NYC Parks & Urban Ecology — QGIS Spatial Analysis Project
- nalwogaimmaculate3
- Dec 22, 2025
- 2 min read
Project Overview
This project explores urban environmental patterns in New York City QGIS. It integrates multiple spatial datasets — including tree census, park properties, squirrel sightings, and playground locations — to visualize ecological distribution and perform spatial queries. The goal was to analyze biodiversity and tree characteristics in relation to public spaces.
Data Sources
2015 Street Tree Census (CSV)
2018 Central Park Squirrel Census (GeoJSON)
NYC Parks Properties (GeoJSON)
NYC Play Areas (GeoJSON)
NYC Bike Routes (GeoJSON)
Custom Building Layer (created manually)
Technical Workflow
Setup
Loaded all layers into QGIS

Set project CRS to EPSG:3857

Reprojected CSV layers to EPSG:4326 for accurate geolocation
Tree Census Visualization
Imported CSV with longitude/latitude as X/Y coordinates
Converted `stump_diam` column from text to numeric
Applied graduated symbology using natural breaks (7 classes)
Filtered out values from 0-1 to focus on meaningful tree widths
Switched visualization method to size-based (2-18 mm) for better diameter representation
Squirrel Census Analysis
Symbolized by primary_fur_color using categorized symbology
Applied natural breaks into 7 classes for visual clarity

Custom Data Creation
Digitalized a new building layer manually from the map
Added it as a separate vector layer for spatial reference
Spatial Analysis Question
How many squirrels were seen near playgrounds?
Used Play Areas layer
Created a buffer zone of 200m around the playgrounds
Performed point-in-polygon count using squirrel data
Symbolized results with graduated symbology (9 classes)
Filtered out parks with zero squirrel sightings
Skilled Demonstrated
CRS management and reprojection
Layer styling (categorized, graduated, size-based)
Data cleaning and numeric formatting
Buffer analysis and spatial queries
Manual digitization and custom layer creation
Map interpretation and ecological insight
Network Analysis: Safest Bike Routes in NYC to Central Park
Using QGIS's Shortes Path (Point to Layer) tool, I performed a network analysis on NYC's bike route data to identify the safest paths for cyclists.
Created a new shapefile layer called Bike Points
Plotted 3 custom points across Manhattan
Used Shortes Path (Point to Layer) with advanced parameters
Default speed: 50km/h
Start point: manually selected
The tool calculated optimal paths rideable paths across VYC
Final output visualized the safest rideable paths across NYC
This analysis demonstrates applied GIS skills in urban mobility planning and spatial network modeling.
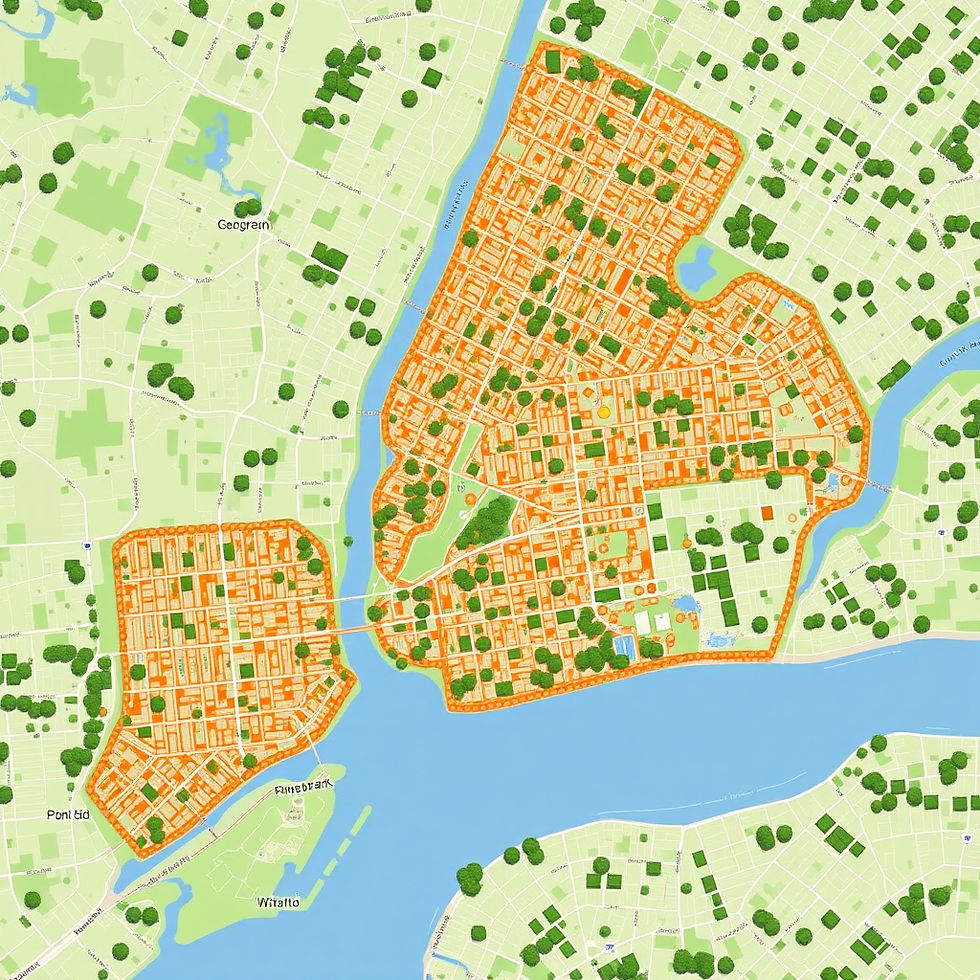
Web Map: Refactored NYC Tree Census
I also built a web map using QGIS and qgi2web (Leaflet) to visualize NYC's tree census data.
Cleaned and refactored tree census attributes
Styled tree points by species and density
Exported the interactive map using qgis web
Central Park and surrounding neighborhoods were emphasized
Map includes spatial markers, basemap context, and urban green-space distribution
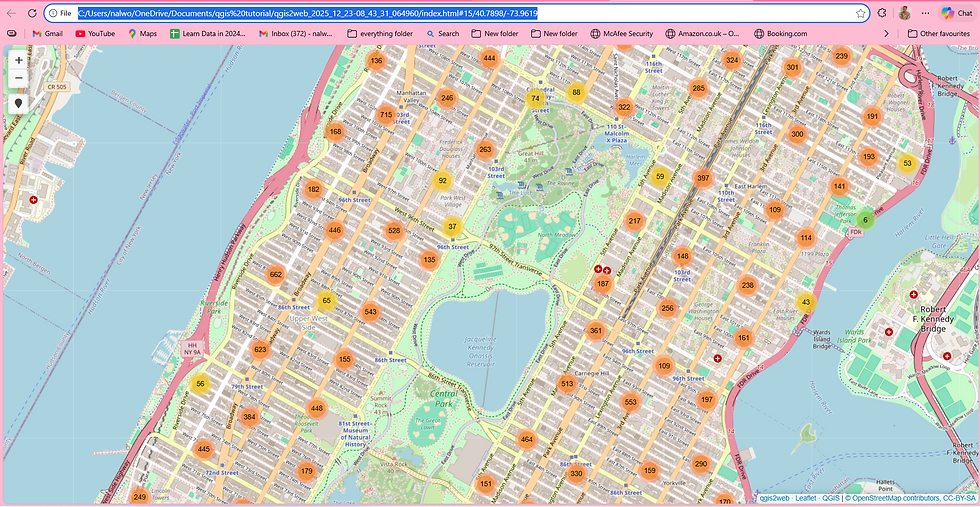
This web map showcases environmental data, demonstrating network modeling and urban environment mapping.


Comments