IT Monthly KPI Dashboard - Personal Project
- nalwogaimmaculate3
- Sep 13, 2025
- 2 min read
Updated: Sep 17, 2025
In this dashboard we are building visualizations for our IT department on key KPI Metrics.
Link to Dashboard:
Overview:
Total Calls Handled: Measures agent workload and call volume trends
Resolution Rates by Agents

Resolved Calls by Agents

Speed of Answer

Average Handling Time (AHT): Assesses operational efficiency and time management.
Inbound Calls Today

Average Call Volume by Day: Identifies which days of the week experience the highest and lowest call traffic, helping managers optimize scheduling and resource allocation.
Call Volume During Week

First Call Resolution (FCR): Evaluates service quality and issue resolution effectiveness.
Resolution Rate

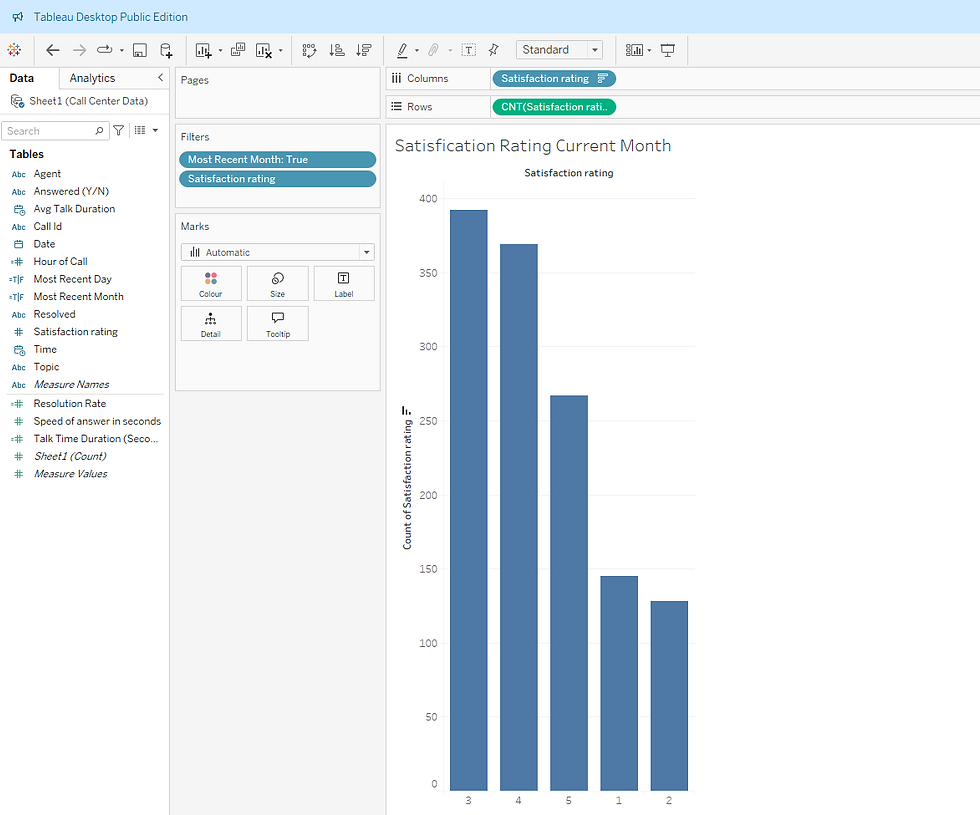
Customer Satisfaction Score (CSAT): Reflects client experience and resolution effectiveness.
Satisfaction Rating
Abandonment Rate: Highlights potential gaps in staffing or wait time management.
Mini Case Study:
Client or Context: "A manager in the Call Center (Help Desk) wants a Monthly KPI Dashboard. We are to create a dashboard to give him useful information about this data, but he isn't sure exactly what he wants."
Problem: "He wants to track how his employees are doing as well as some overall information about the calls.
Solution: "Built an interactive dashboard with filters and trend analysis."
Result: "Improved decision-making and reduced handling time."
Design Approach:
I used Tableau to create a clean, intuitive layout that allows users to:
Compare agent performance across multiple KPIs.
Filter by month or day and more to explore specific trends.
Spot outliers and patterns that inform coaching and staffing decisions.
Impact:
This dashboard empowers call center managers to:
Recognize high-performing agents and reward excellence.
Identify training needs based on KPIs fluctuations.
Reduce call wait times and improve customer satisfaction.
Make Strategic staffing decisions based on real-time insights.
Tools Used:
Tableau, Excel (for data prep), calculated fields, filters, and dynamic visuals.


Comments