US Debt Tracker – Forecasting America’s Fiscal Future
- nalwogaimmaculate3
- Nov 5, 2025
- 1 min read
Updated: Nov 8, 2025
Excel-based analysis of historical and projected U.S. public debt
Link: US Debt Tracker.xlsx
Overview:
This project analyzes U.S. Debt trends using Excel. I cleaned and modeled historical data, calculated yearly percentage increases, and projected future debt levels through 2028. The goal was to uncover patterns and visualize fiscal shifts over time.
Objectives
Analyze yearly debt percentage increases
Identify consistently growing debt sources
Forecast public debt for the next decade
Tools Used
Excel (formulas, charts, projections)
Data cleaning techniques
Visual storytelling
Key Visuals
Yearly percentage increase chart

Monthly average debt increase bar graph

Projected debt area chart
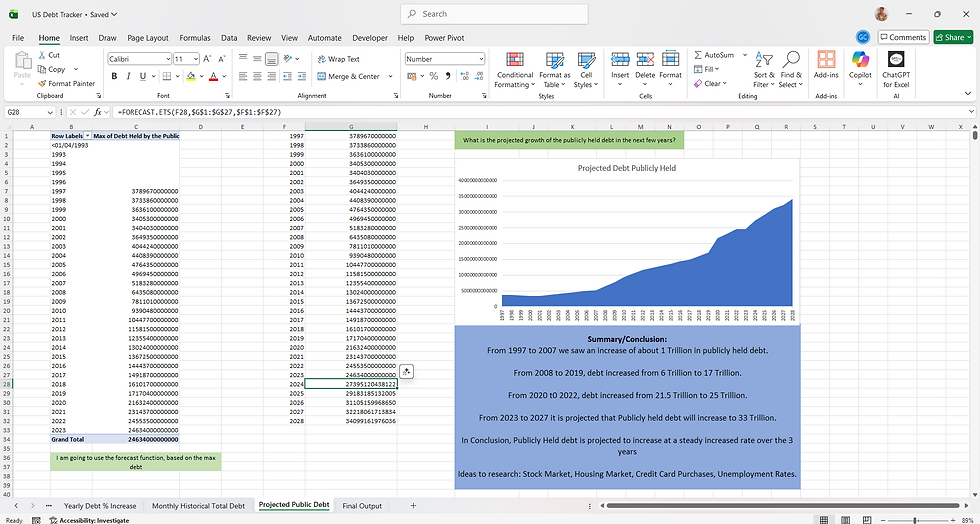
From 2023 to 2027 it is projected that Publicly held debt will increase to 33 Trillion. The sharpest rise occurred in 2020, likely due to COVID-19 stimulus spending. This analysis highlights the importance of fiscal planning and long-term forecasting.”


Comments