HR Analytics Dashboard built Power BI
- nalwogaimmaculate3
- Dec 22, 2025
- 2 min read
Updated: Dec 22, 2025

Project Overview
This HR Analytics Dashboard analyzes employee attrition patterns across demographics, job roles, salary bands, and tenure. The goal of the project was to build a clean, interactive dashboard that helps HR teams understand why employees leave and where strategic interventions are needed.
This project demonstrates my skills in:
Power Query data cleaning
DAX measure creation
Data modeling
HR analytics
Dashboard design and storytelling
Data Preparation (power Query)
All data cleaning and transformation was completed in Power Query before modeling. Key steps included:
Removing nulls and duplicate records
Standardizing text finds (Department, JobRole, Education)
Formatting numeric fields (Age, MonthlyIncome, YearsAtCompany)
Creating helper columns;
Attrition_Count (1 = Yes, 0 = No)
Age_Group (18–25, 26–35, 36–45, 46–55, 55+)
Salary_Band (Up to 5K, 5K–10K, 10K–15K, 15K+)
These transformations ensured the dataset was clean, consistent, and ready for analysis.
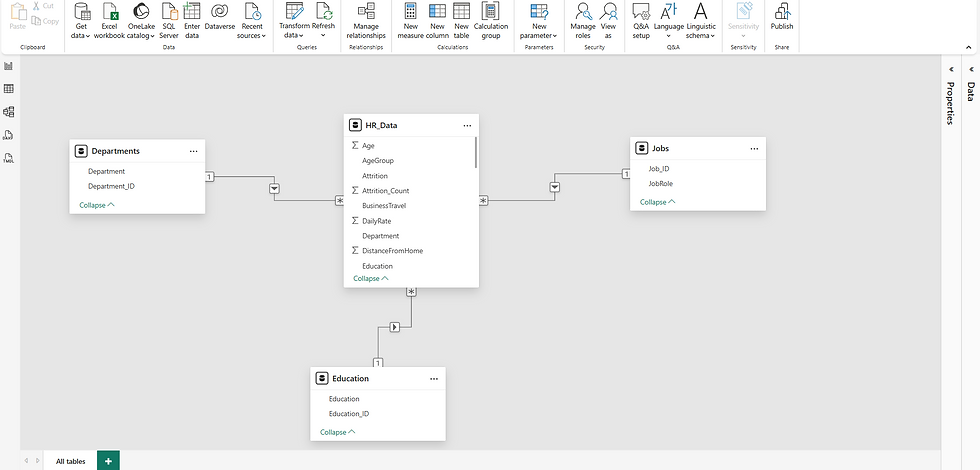
Data Model Design
The dashboard is powered by a clean relational model built in Power BI:
HR_Data (Fact Table): Core employee records with age, salary, tenure, attrition, and job role
Departments Table: Normalized department names linked to HR_Data
Jobs Table: Job roles and IDs for role-based analysis
Education Tables: Education levels grouped for attrition insights
All tables are connected via one-to-many relationships, enabling clean filtering, accurate aggregations, and scalable reporting.
DAX Measures Used in the Dashboards
Attrition Rate
This measure calculates the percentage of employees who left the company
Attrition_Rate = SUM(HR_Data[Attrition_Count]) / SUM(HR_Data[EmployeeCount])Employee Count
Counts the total number of employees in the dataset.
Employee_Count = COUNTROWS(EMPID)Attrition Count
Counts the number of employees who left the company
Attrition_Count = CALCULATE(COUNTROWS(HR_DATA), HR_DATA[Attrition] = "Yes")Average Age
Average_Age = AVERAGE(HR_DATA[Age])Average Salary
Average_Salary = AVERAGE(HR_DATA[MonthlyIncome])Average Tenure
Average_Tenure = AVERAGE(HR_DATA[YearsAtCompany])Dashboard Highlights
Summary KPIs
Employee Count: 1,480
Attrition Cases: 238
Attrition Rate: 16%
Average Age: 37
Average Salary: 6.5K
Average Tenure: 7 years

These KPIs provide a quick overview of workforce health.
Attrition Insights
By Gender
Male: 151
Female: 87
By Age Group
26-35: Highest attrition (116 cases)
18-25: 44
36-45: 43
46-55: 27
55+: 8
By Education
Life Sciences: 37.39%
Medical: 26.47%
Marketing: 15.13%
Technical Degree: 13.45%
Other: 4.62%
By Salary Band
Up to 5K: 163
5K-10K: 49
10:15K: 21
15K+: 5
By Years at Company
Attrition peaks at:
1 year (59 cases)
Smaller peaks at 4 and 6 years
By Job Role
Reach Scientist: 100
Human Resources: 58
Sales Representative: 44
Laboratory Technician: 31
Key Insights
Younger employees (26-35) show the highest turnover
Lower salary bands experience significantly more attrition
Most attrition occurs within the first year, suggesting onboarding or job-fit issues
Education background influences attrition patterns
These insights help HR teams target retention strategies more effectively.


Comments